Web Design & Development
Image with Map: The Complete Guide to Clickable Image Hotspots
Everything you need to build, optimise, and scale every type of image with map — from basic HTML hotspots to modern SVG and CSS interactive geography.
Quick Answer
An image with map is a single graphic that contains multiple clickable regions — called hotspots — each linking to a unique URL or triggering an action. Specifically, an image with map is an HTML technique that combines an element to overlay invisible interactive zones on any photograph, diagram, or illustration. Each zone behaves as an independent hyperlink based on where the user clicks.
What Is an Image with Map?
An image with map is, at its core, the union of two HTML concepts: the element that overlays invisible interactive regions on top of it. Unlike a regular linked image — which sends every click to a single destination — an image map routes each click based on the precise pixel region the user interacts with.
According to the MDN Web Docs reference for the HTML map element, the tag works in conjunction with elements and an image’s usemap attribute to define clickable zones. The HTML standard supports three hotspot shapes: rect (rectangle), circle, and poly (polygon, for irregular outlines like country borders).
Furthermore, the technique has been a cornerstone of interactive web design since the earliest days of HTML. It remains powerfully relevant today for geographic visualisations, product diagrams, floor plans, and educational infographics. In short, the image with map technique bridges visual design and functional interactivity without requiring any JavaScript framework.
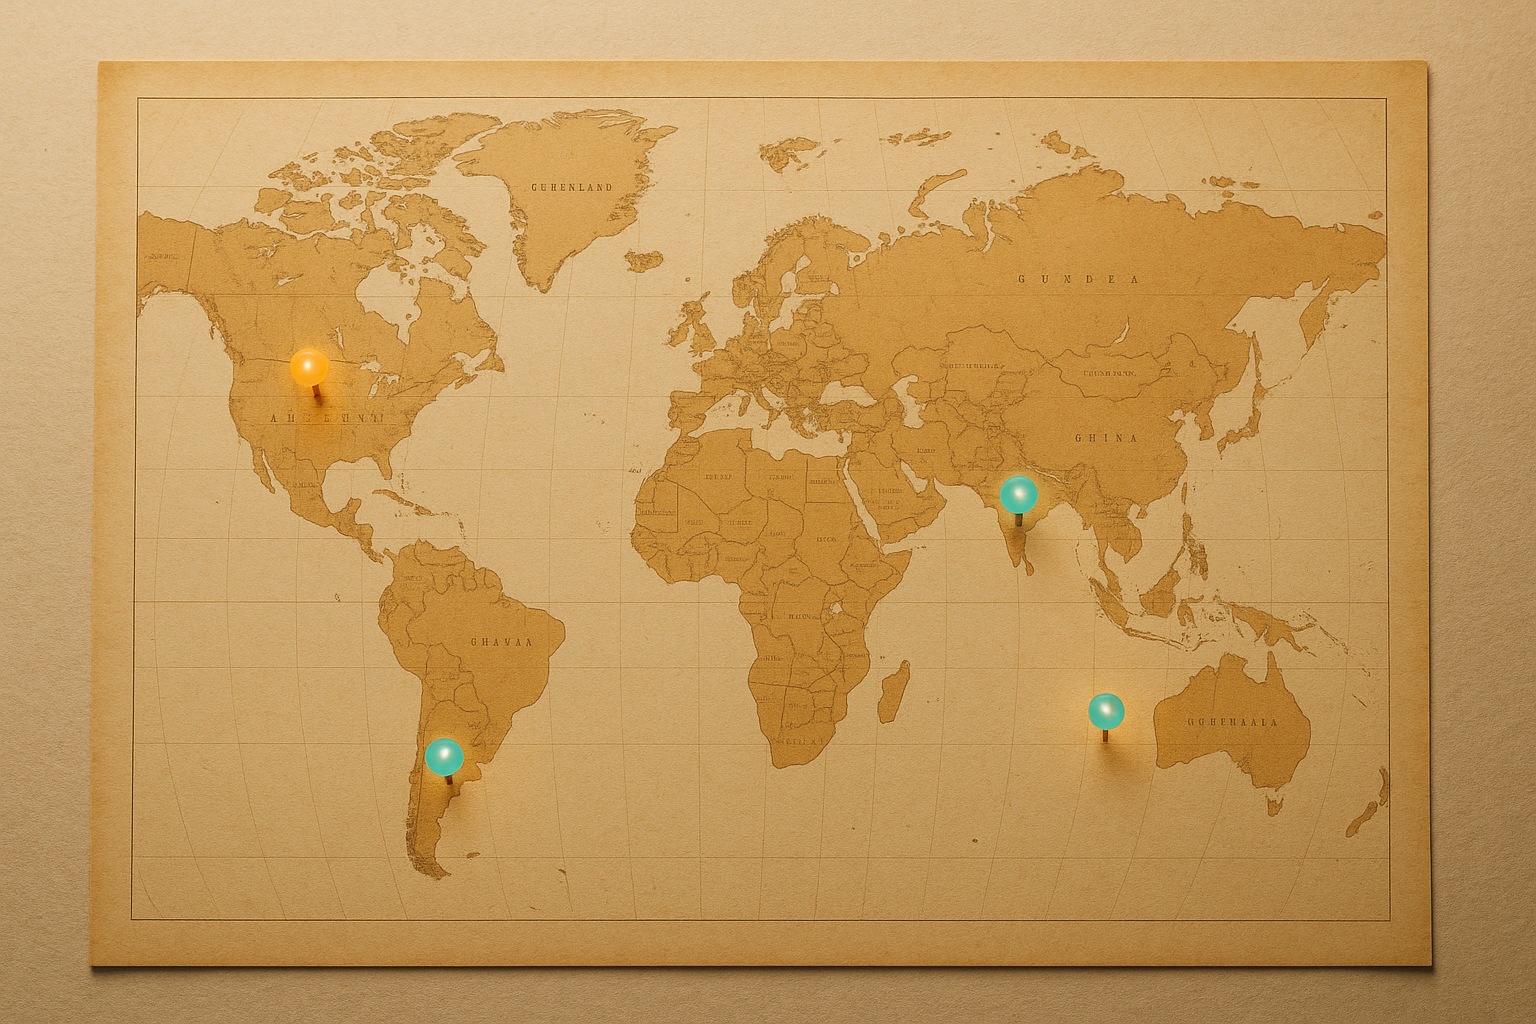
A classic image with map — distinct geographic zones each acting as an independent interactive hotspot.
Why Use an Image with Map on Your Website?
The practical benefits of an image with map extend far beyond novelty. When implemented thoughtfully, image maps reduce the need for multiple separate images, keep visual layouts clean, and deliver a richer experience to users who expect interactivity. Below are the primary use cases where image maps genuinely outperform alternatives.
- Geographic navigation maps — Country or regional maps where each territory links to a dedicated page. For example, a Europe overview map where clicking France opens a French travel guide.
- Product showcase images — A single product photo with labelled components that each open specification panels or purchase links.
- Architectural floor plans — Room-by-room navigation for real estate listings, hotel layouts, or venue guides.
- Educational anatomy diagrams — Human body or biological illustrations where each organ or structure links to explanatory content.
- Infographic storytelling — Complex data visuals where each section drills down into supporting detail pages.
- Historical timeline images — A single illustrated timeline where each era or event opens a detailed modal or page.
- Campus or venue maps — University or event venue maps letting visitors click buildings to access department or room information.
When an Image Map Beats a Grid of Buttons
Specifically, the image with map approach wins when the geography or shape of your visual is the primary navigational cue. A grid of buttons loses context. However, a clickable map of the United States — where each state is a hotspot — communicates spatial relationships instantly and intuitively. Consequently, users engage faster and bounce less.
How to Create an Image with Map: Step-by-Step
Building a functional image with map requires attention to coordinates, accessibility, and responsiveness. Therefore, follow these six steps for a production-ready result.
Step 1
Choose and Prepare Your Image
Select a high-resolution image with clearly distinguishable regions. Optimise it for web delivery using WebP format with JPEG or PNG fallbacks. The cleaner the visual boundaries between regions, the more intuitive the hotspot experience will feel. Additionally, make sure your image has a fixed natural width and height — this is critical when you record pixel coordinates in the next step.
Step 2
Map Out Your Hotspot Coordinates
Use a dedicated image map editor — such as image-map.net — or your browser’s developer tools to record pixel coordinates for each region. For rectangles, you need the top-left and bottom-right corner coordinates. Circles require a centre point and a radius value. Polygons need every vertex listed in clockwise sequence. Specifically, write these values down in a separate document before touching any HTML — this prevents errors later.
Step 3
Write the HTML Map and Area Elements
Construct your map markup with a unique name attribute and populate it with elements. Each area element must include shape, coords, href, and a descriptive alt attribute for accessibility. For example:

Step 4
Link the Image to the Map
The connection between your image and your map definition is made through the usemap attribute on the name attribute, preceded by a hash symbol — for example, usemap="#worldmap". Without this link, the map element has no visual attachment and none of your hotspots will function.
Step 5
Add Accessibility Attributes
Every element must carry a meaningful alt attribute. Screen readers treat area elements exactly like links — so vague or missing alt text breaks the experience for keyboard and assistive technology users. In addition, add tabindex="0" to each area to ensure keyboard navigation works correctly, and apply a visible CSS outline on focus to meet WCAG 2.1 AA compliance.
Step 6
Test and Optimise for Responsiveness
HTML image map coordinates are fixed in pixels. As a result, they break when the image scales on smaller screens. Test across desktop, tablet, and mobile viewports before going live. For responsive projects, use the RWD Image Maps jQuery plugin, which recalculates pixel coordinates dynamically as the image resizes. Alternatively, migrate your hotspots into an SVG-based solution where coordinates scale proportionally with the container — the superior long-term approach.

Writing clean, accessible HTML is the foundation of any well-built image with map implementation.
Image with Map Accessibility and SEO Best Practices
An image with map that ignores accessibility is a liability, not an asset. Consequently, every area element must carry a meaningful alt attribute. The parent alt that summarises the entire image’s purpose.
SEO Value of Image Map Hotspots
From an SEO standpoint, search engine crawlers follow the href values in your elements exactly as they would standard anchor links. Therefore, your image map hotspots pass link equity to their destination pages — a significant benefit worth leveraging in your internal linking strategy. For deeper guidance on structuring internal links, RankAuthority offers comprehensive SEO resources covering both technical and content-level optimisation.
Keyword-Rich Alt Text Strategy
Each alt attribute on your area elements is an opportunity to include descriptive, keyword-relevant text. However, avoid keyword stuffing — write natural, descriptive labels that genuinely describe the destination. For example, alt="France travel guide" is both accessible and SEO-positive.
Pro Tip — Keyboard Accessibility
Add tabindex="0" to each element so keyboard users can navigate your image map without a mouse. Pair this with a visible focus outline style to meet WCAG 2.1 AA compliance standards. This one addition significantly expands your accessible audience.
Modern Alternatives: SVG and CSS-Based Map Images
While the traditional HTML image map remains valid and universally browser-supported, modern web projects increasingly favour SVG-based approaches. An SVG map image uses vector paths that scale perfectly at any resolution. In addition, SVG supports CSS hover states natively and integrates cleanly with JavaScript for dynamic data binding — making it the preferred choice for data-driven geographic dashboards.
HTML Image Map vs. SVG Map Image: Side-by-Side Comparison
HTML Image Map
- Simple to implement quickly
- Works on any image format
- Fixed pixel coordinates
- Responsiveness requires JS shim
- Supported in all browsers
- Best for simple use cases
SVG Map Image
- Fully responsive by nature
- Supports CSS animations
- Scales without quality loss
- More complex to author
- Ideal for data visualisation
- Supports tooltip overlays natively
CSS-Only Hotspot Overlays
A third approach — CSS positioned overlays — uses position: absolute anchor tags layered over a relatively positioned container image. This method is responsive by default, requires no JavaScript, and supports rich hover animations. However, it demands precise percentage-based positioning, which can be time-consuming to calibrate. Consequently, it works best for images with large, clearly bounded regions.
JavaScript-Powered Interactive Map Images
For the most feature-rich results, JavaScript libraries such as Leaflet.js (an open-source interactive map library) and D3.js (a data visualisation framework) offer complete control over geographic data rendering, zoom behaviour, and tooltip interactions. These tools are specifically designed for complex geographic dashboards where an image with map alone would be insufficient. Similarly, commercial tools like Mapbox and Google Maps API provide hosted tile-based map images with full interactivity built in.
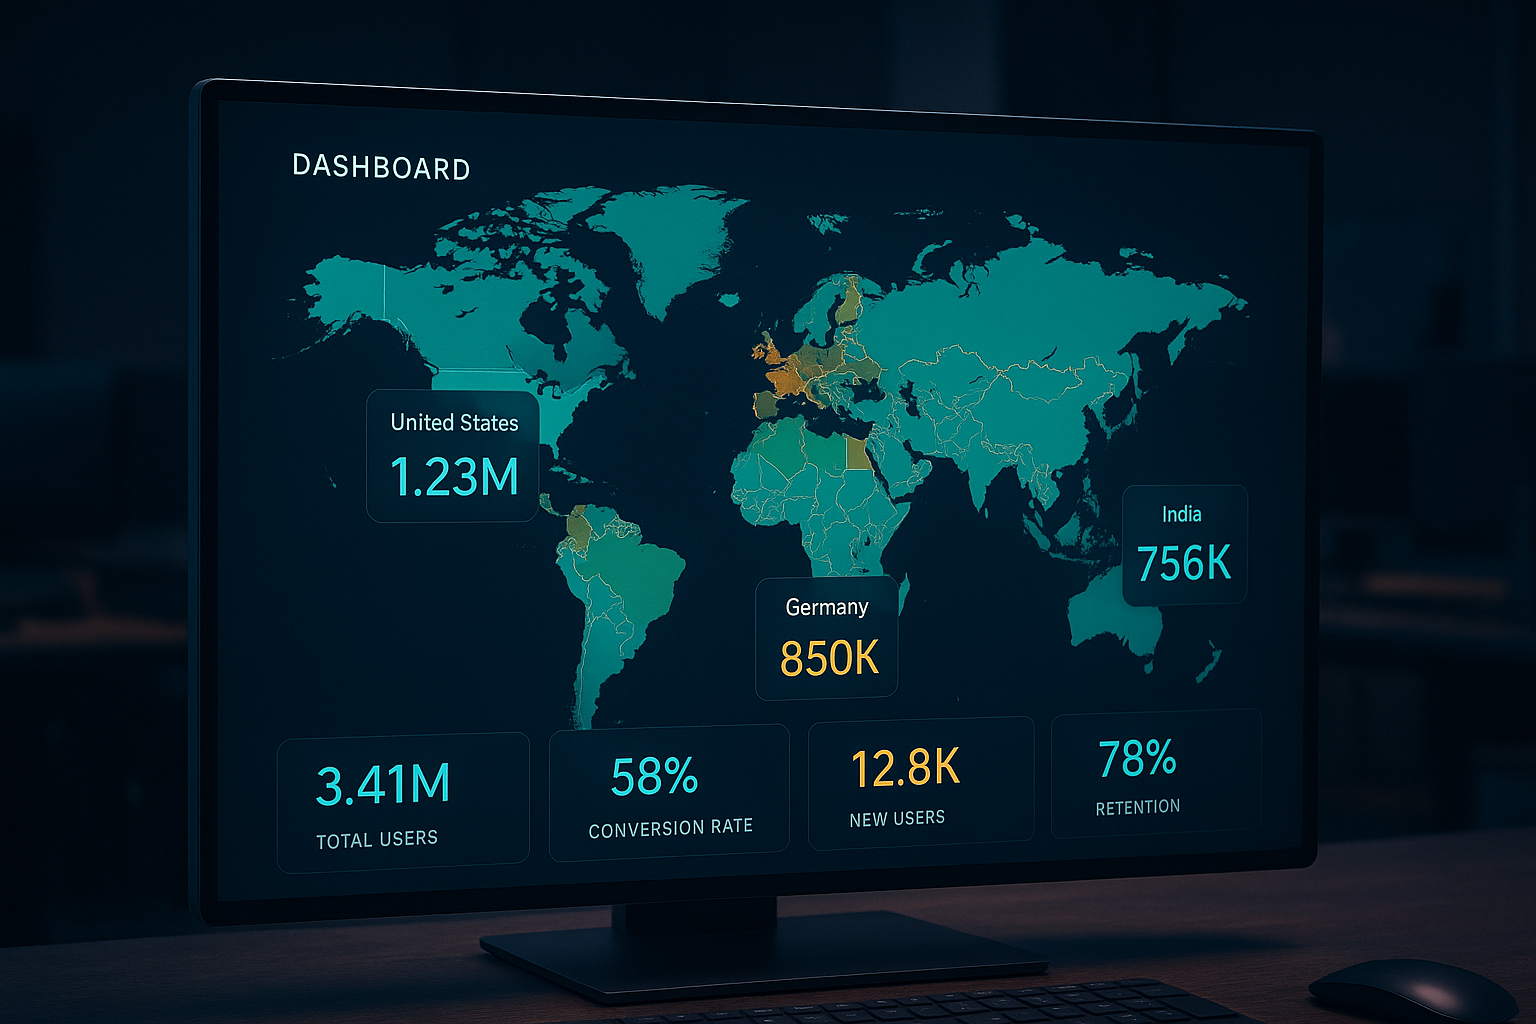
SVG-based map images offer fluid responsiveness and rich styling that traditional HTML image maps cannot match.
Performance Optimisation for Image Map Pages
Every image with map is only as performant as the underlying image file. Large, unoptimised images are the most common performance bottleneck in image map implementations. Therefore, follow these principles to keep your pages fast and your Core Web Vitals scores healthy.
- Serve images in WebP format with JPEG or PNG fallbacks for maximum compression without quality loss.
- Use the
loading="lazy"attribute on images that appear below the fold — this defers loading until the user scrolls near the image. - Specify explicit
widthandheightattributes on your - For complex geographic map images, consider lazy-loading the SVG itself or deferring non-critical hotspot JavaScript until after the main content renders.
- Use a CDN (Content Delivery Network) to serve your map images from edge locations close to your users, reducing latency significantly.
- Compress SVG files with tools like SVGO (SVG Optimiser) to strip redundant metadata, often reducing file size by 40–70% with no visual loss.
Core Web Vitals and Image Maps
Google’s Core Web Vitals — Largest Contentful Paint (LCP), Cumulative Layout Shift (CLS), and Interaction to Next Paint (INP) — are directly affected by how you implement your image with map. Specifically, a large map image that loads without declared dimensions will cause a significant CLS spike. Similarly, a heavy SVG loaded synchronously in the delays LCP. Consequently, always profile your implementation with Google PageSpeed Insights before publishing.
Common Mistakes to Avoid with Image Maps
Even experienced developers make predictable errors when building an image with map for the first time. However, most of these mistakes are easy to avoid once you know what to look for.
- Mismatched map name and usemap value — The most common error. The
usemapvalue must start with#and exactly match the map’snameattribute, including case sensitivity in some browsers. - No fallback for mobile — HTML image maps do not scale by default. As a result, hotspots become misaligned on smaller screens without a responsiveness fix.
- Missing or empty alt attributes — Leaving
alt=""on area elements makes your map inaccessible and signals poor content quality to search engines. - Overlapping hotspot regions — When two area polygons overlap, only the first one in the HTML source will be clickable. Therefore, plan your coordinate layout carefully to avoid overlaps.
- Using image maps for pure decoration — If your regions don’t link to distinct, meaningful destinations, a regular image with a tooltip overlay is a better user experience.
Best Tools for Creating an Image with Map
The right tool dramatically speeds up the process of building an image with map. In particular, online editors eliminate the need to manually calculate pixel coordinates. Below are the top options available in 2025.
image-map.net
A free, browser-based drag-and-drop image map editor. Upload your image, draw rectangles, circles, or polygons over your regions, and the tool auto-generates the complete HTML code. Ideal for quick prototypes and straightforward use cases.
Inkscape (Free, Open Source)
The industry-standard free vector editor. Use Inkscape to draw SVG paths over your map image and export interactive SVG files with embedded link data. The SVG output is fully responsive and supports CSS styling.
Adobe Illustrator
The professional standard for vector illustration. Illustrator’s SVG export with slicing tools and hyperlink support makes it the choice for complex map image projects where design quality is paramount.
Figma with SVG Export
Figma’s collaborative design environment, combined with its clean SVG export, is increasingly the tool of choice for teams building interactive map image assets. Plugins like Map Maker extend its geographic capabilities further.
Frequently Asked Questions About Image with Map
What is an image with map in HTML?
An image with map in HTML is an image element linked to a element that defines multiple clickable hotspot regions. Each region can link to a different URL, making a single image serve as multi-destination navigation. It is defined using the usemap attribute on the image and corresponding tags inside the map element.
Is an HTML image map still relevant in 2025?
Absolutely. While SVG has become the modern standard for complex interactive maps, HTML image maps remain a practical, low-dependency solution for straightforward use cases. They require no JavaScript libraries and are supported universally across all current browsers. Furthermore, for simple geographic navigation, product diagrams, and educational content, the HTML image map is still the fastest path to a working solution.
What tools can I use to create an image with map?
The most accessible tool is image-map.net, which provides a drag-and-drop interface for placing hotspots and auto-generates the HTML code. For SVG-based map images, Inkscape, Adobe Illustrator, or Figma with SVG export are the professional standards. For data-driven geographic maps, Leaflet.js and D3.js are the most powerful open-source options.
How do I make an image with map responsive?
The most reliable HTML approach is to use the RWD Image Maps jQuery plugin, which recalculates pixel coordinates dynamically as the image resizes. Alternatively, wrapping your image in a percentage-width container and applying width: 100% on the image, combined with the plugin, produces a fully fluid layout. However, for long-term maintainability, migrating to an SVG-based image map is the better investment.
Does an image map affect SEO?
Yes, positively. Search engine crawlers follow the href values in your elements just as they follow standard anchor links. As a result, each hotspot in your image with map passes link equity to its destination page. Additionally, descriptive alt text on both the image and area elements contributes to contextual signals that reinforce your page’s topical relevance.
Can I use an image with map on a WordPress site?
Yes. You can add image map HTML directly inside WordPress using the Custom HTML block in the Gutenberg editor, or via a plugin like Image Map Pro that provides a visual builder interface. However, ensure your WordPress theme does not strip and elements from the output — some content sanitisation filters do remove them.
Conclusion: Mastering the Image with Map Technique
Whether you are building a simple regional navigation panel or a data-rich geographic dashboard, mastering the image with map technique gives you a flexible, SEO-friendly tool that bridges visual design and functional interactivity. From the foundational HTML element to modern SVG and JavaScript-powered approaches, the core principles remain consistent: define your regions precisely, write accessible markup, optimise your image assets, and always test for responsiveness across every device.
In addition, remember that every hotspot in your image with map is an internal link — use it strategically to reinforce your site architecture and pass equity to your most important pages. For those who want to align their image map strategy with broader on-page SEO and content performance goals, the resources at RankAuthority provide actionable frameworks for turning every visual element into a measurable traffic and engagement asset.
Key Takeaway
An image with map is one of the most underutilised tools in a web designer’s toolkit. When built with clean HTML, strong accessibility practices, performance-first thinking, and a clear internal linking strategy, it delivers interactive experiences that engage users and support your site’s SEO simultaneously — all without requiring a single JavaScript framework.